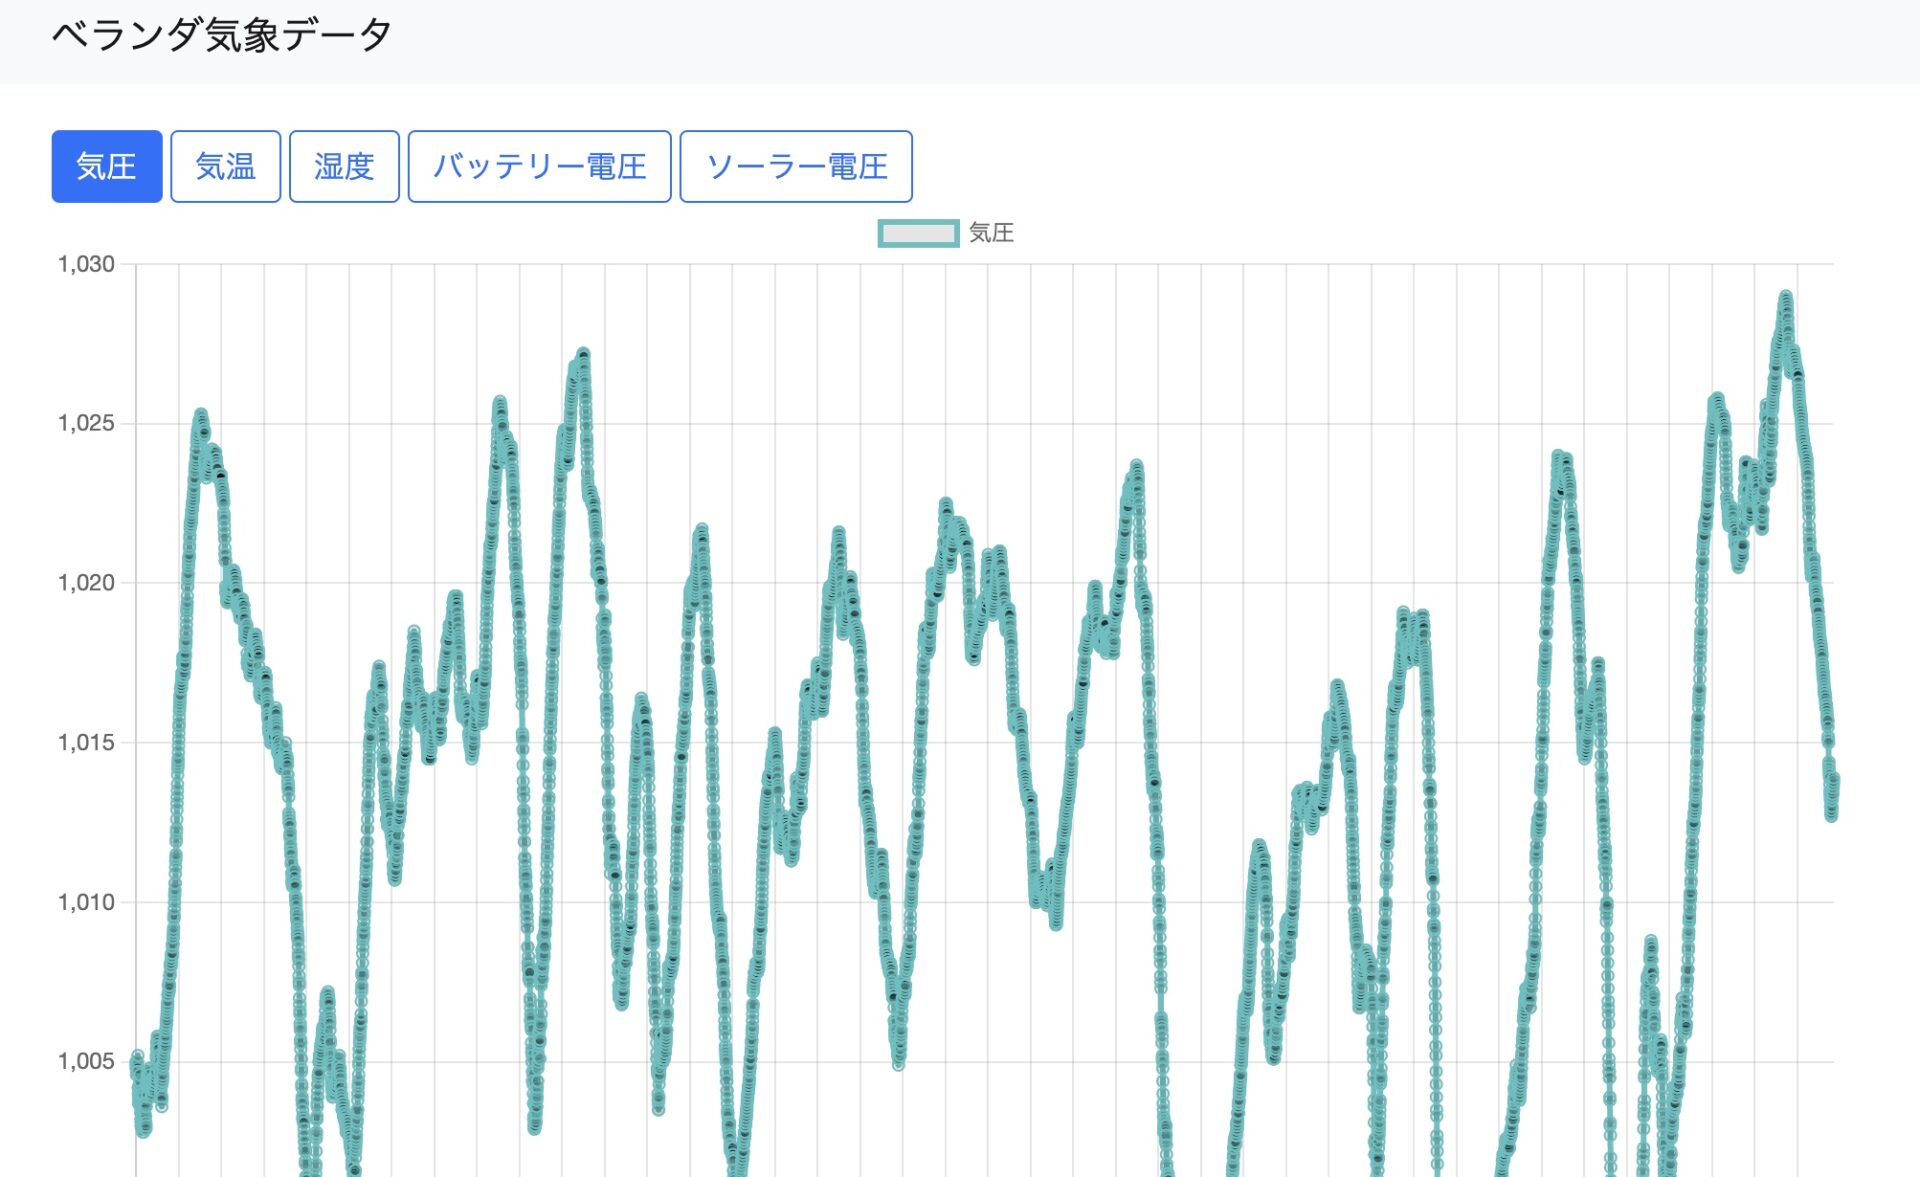
ソーラー発電&Arduino測定の気象データをChart.jsでグラフ化④日付形式
本記事にはアフィリエイト広告が含まれます。
前回は日付範囲指定が出来るように調整しました。
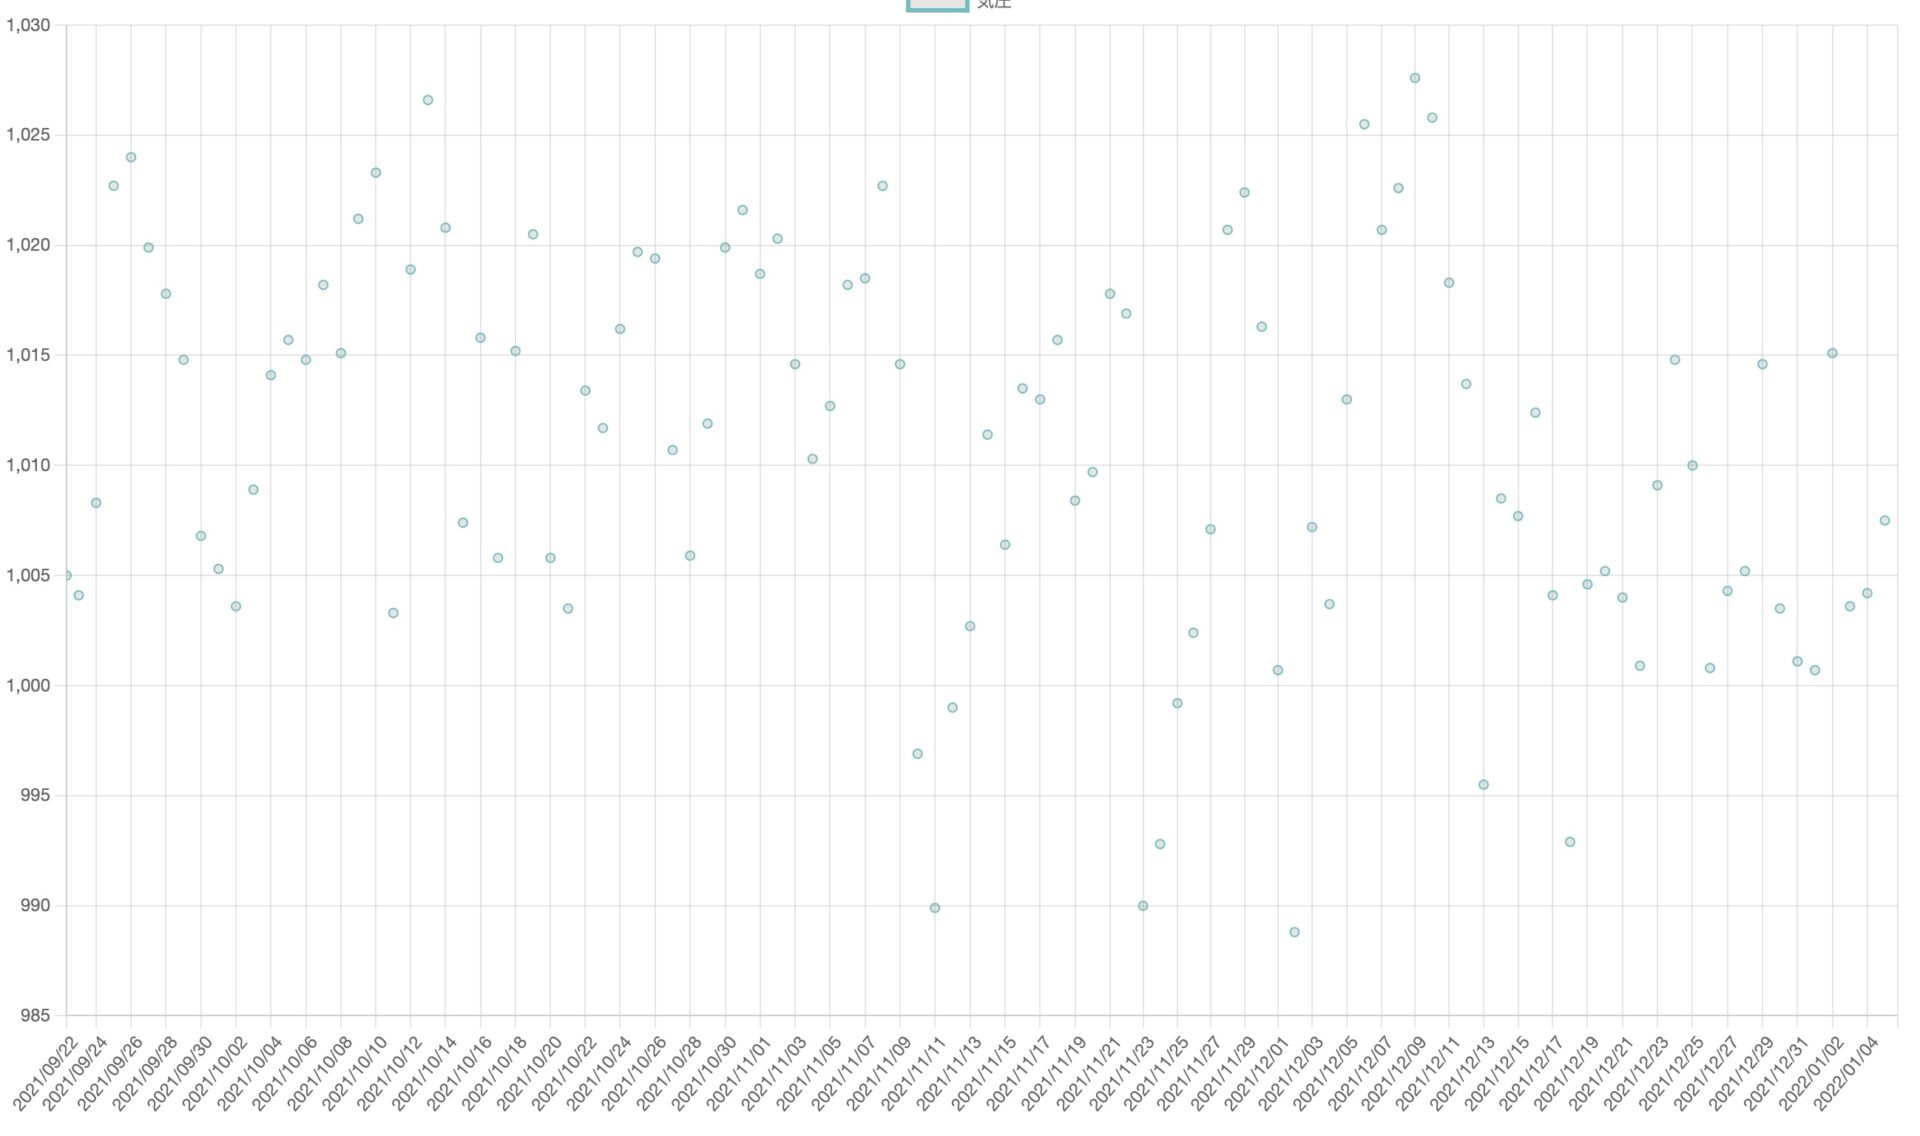
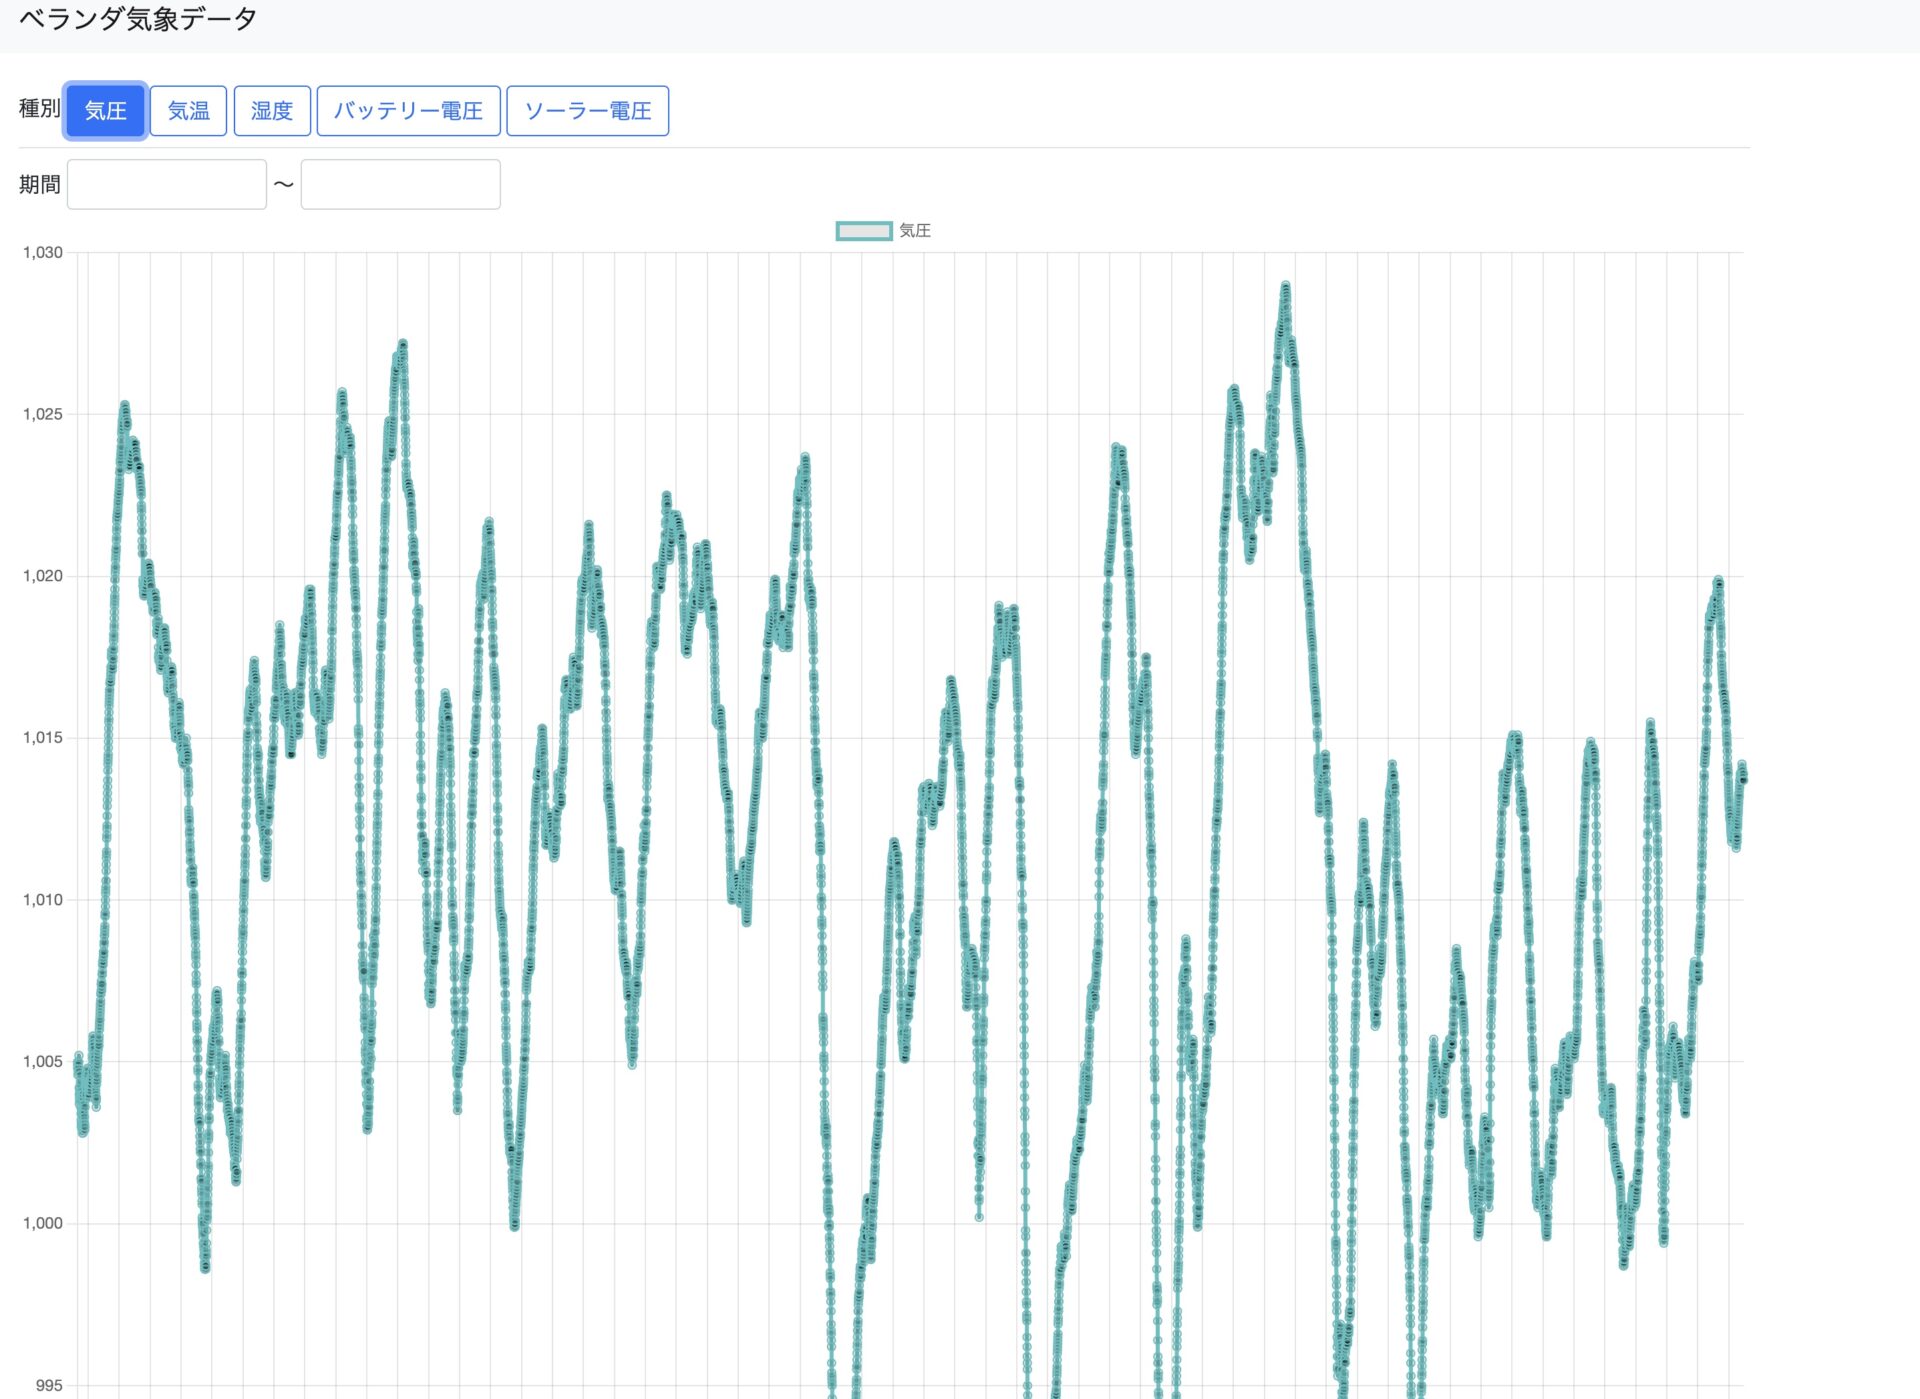
ただこれだと、ログデータは10分毎のデータとなっているため、
日付を狭めた時に同じ日付が並んでラベルに表示されてしまい、
見づらくなってしまいました。
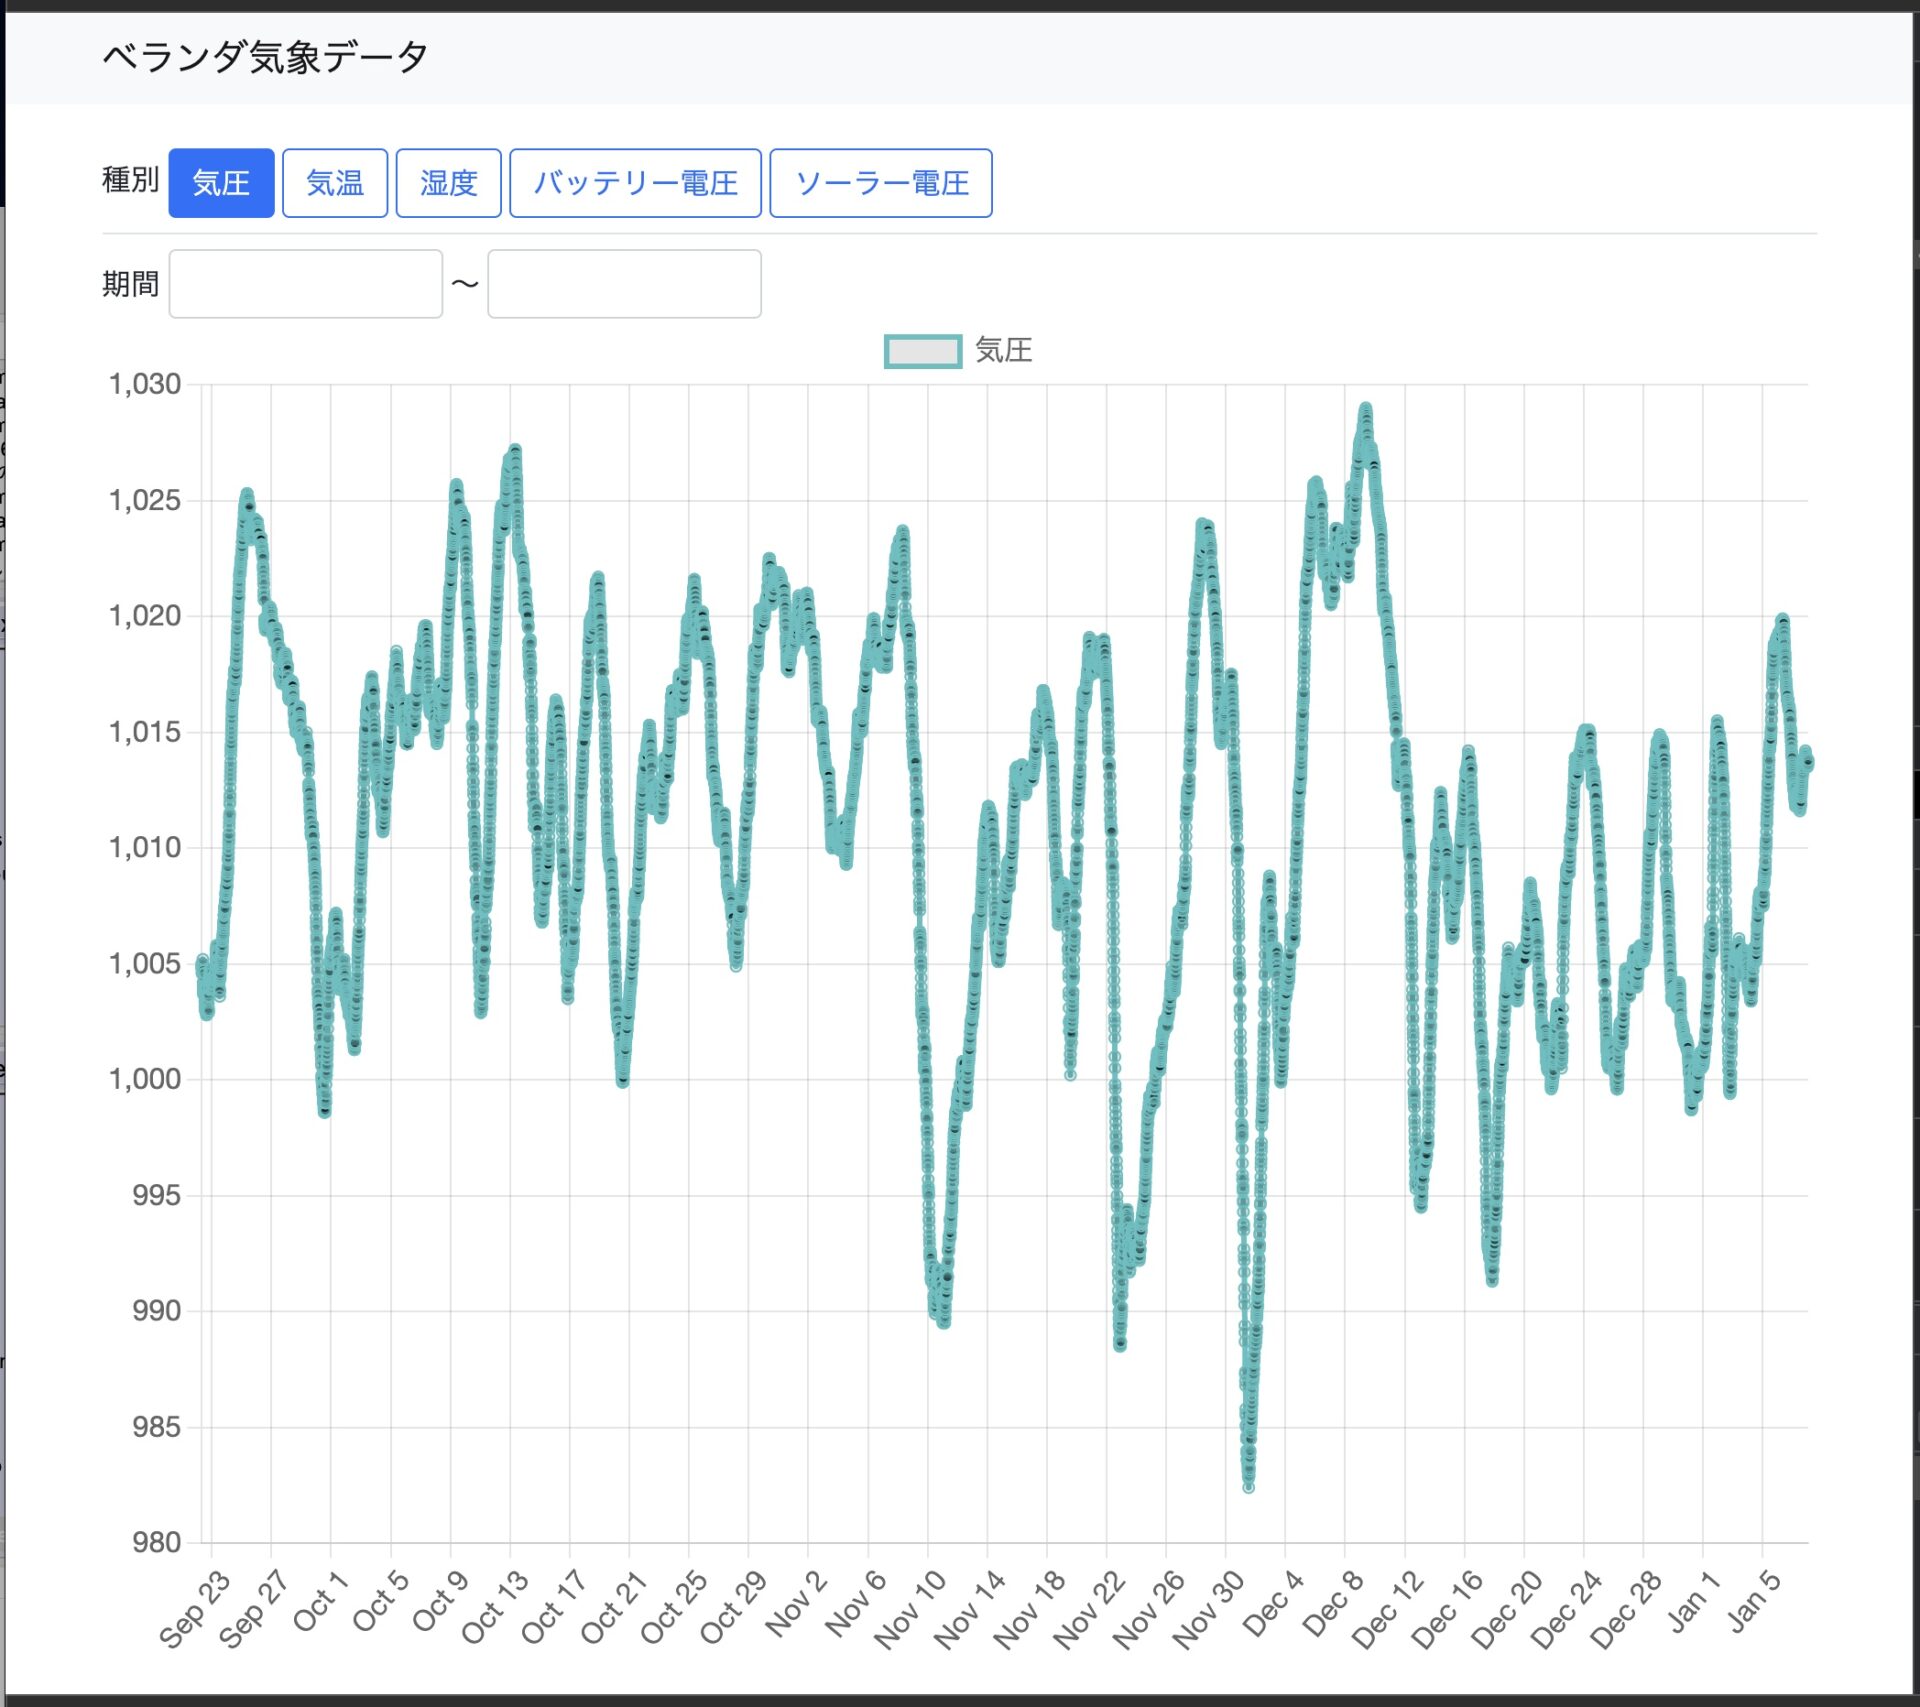
なのできちんと「日付」として扱えるようにグラフを調整しました。
目次
ソースコード
|
1 2 3 4 5 6 7 8 9 10 11 12 13 14 15 16 17 18 19 20 21 22 23 24 25 26 27 28 29 30 31 32 33 34 35 36 37 38 39 40 41 42 43 44 45 46 47 48 49 50 51 52 53 54 55 56 57 58 59 60 61 62 63 64 65 66 67 68 69 70 71 72 73 74 75 76 77 78 79 80 81 82 83 84 85 86 87 88 89 90 91 92 93 94 95 96 97 98 99 100 101 102 103 104 105 106 107 108 109 110 111 112 113 114 115 116 117 118 119 120 121 122 123 124 125 126 127 128 129 130 131 132 133 134 135 136 137 138 139 140 141 142 143 144 145 146 147 148 |
<!doctype html> <html lang="en"> <head> <meta charset="utf-8"> <meta name="viewport" content="width=device-width"> <title>ベランダ気象データ</title> <link href="https://cdn.jsdelivr.net/npm/bootstrap@5.0.0-beta1/dist/css/bootstrap.min.css" rel="stylesheet" integrity="sha384-giJF6kkoqNQ00vy+HMDP7azOuL0xtbfIcaT9wjKHr8RbDVddVHyTfAAsrekwKmP1" crossorigin="anonymous"> <link rel="stylesheet" href="//code.jquery.com/ui/1.13.0/themes/base/jquery-ui.css"> </head> <body> <nav class="navbar navbar-light bg-light mb-4"> <div class="container"> <span class="navbar-brand mb-0 h1">ベランダ気象データ</span> </div> </nav> <div class="container"> <div class="button-type border-bottom pb-2 mb-2"> 種別 <button type="button" class="btn btn-outline-primary active" data-mode="airPressure">気圧</button> <button type="button" class="btn btn-outline-primary" data-mode="temperature">気温</button> <button type="button" class="btn btn-outline-primary" data-mode="humidity">湿度</button> <button type="button" class="btn btn-outline-primary" data-mode="batteryVoltage">バッテリー電圧</button> <button type="button" class="btn btn-outline-primary" data-mode="solarVoltage">ソーラー電圧</button> </div> <div class="period"> 期間 <input type="text" class="form-control d-inline-block datepicker" style="width:150px;" id="date-start"> 〜 <input type="text" class="form-control d-inline-block datepicker" style="width:150px;" id="date-end"> </div> <canvas id="myChart" width="400" height="400"></canvas> </div> <script src="https://code.jquery.com/jquery-3.6.0.min.js" integrity="sha256-/xUj+3OJU5yExlq6GSYGSHk7tPXikynS7ogEvDej/m4=" crossorigin="anonymous"></script> <script src="https://cdn.jsdelivr.net/npm/chart.js/dist/chart.min.js"></script> <script src="https://cdn.jsdelivr.net/npm/chartjs-adapter-date-fns/dist/chartjs-adapter-date-fns.bundle.min.js"></script> <script src="https://code.jquery.com/ui/1.13.0/jquery-ui.js"></script> <script> var myChart; var mode = 'airPressure'; // 初期表示:気圧 var weatherData = {}; weatherData.label = { 'batteryVoltage': 'バッテリー電圧', 'solarVoltage': 'ソーラー電圧', 'airPressure': '気圧', 'temperature': '気温', 'humidity': '湿度' }; weatherData.time = []; weatherData.batteryVoltage = []; weatherData.solarVoltage = []; weatherData.airPressure = []; weatherData.temperature = []; weatherData.humidity = []; weatherData.data = []; const str = "<?php echo preg_replace('/\n/',',',file_get_contents('/path/to/file')); ?>"; const str_array = str.split(','); for (var i=0; i<str_array.length; i++) { var _str = str_array[i].replace(/ /,',').replace(/\t/g,',').replace(/ /g,''); var _data = _str.split(','); weatherData.time[i] = _data[0] + ' ' + _data[1]; weatherData.batteryVoltage[i] = _data[2]; weatherData.solarVoltage[i] = _data[3]; weatherData.airPressure[i] = _data[4]; weatherData.temperature[i] = _data[5]; weatherData.humidity[i] = _data[6]; } function drawMyChart(){ for (var i = 0; i < str_array.length; i++) { weatherData.data[i] = { x: new Date( weatherData.time[i] ), y: weatherData[mode][i] } } const ctx = document.getElementById('myChart').getContext('2d'); if (myChart) { myChart.destroy(); } myChart = new Chart(ctx, { type: 'line', data: { datasets: [{ label: weatherData.label[mode], data: weatherData.data, fill: false, spanGaps: true, borderColor: 'rgb(75, 192, 192)', tension: 0.1 }] }, options: { responsive: true, scales: { x: { type: 'time', time: { unit: 'day', }, min: weatherData.min, max: weatherData.max } } } }); } drawMyChart(); // グラフ切替 $('.button-type button').click(function(event) { if( !$(this).hasClass('active') ) { $('.button-type button').removeClass('active'); $(this).addClass('active'); mode = $(this).data('mode'); drawMyChart() } }); // datepicker $('.datepicker').datepicker({ dateFormat: 'yy/mm/dd', onSelect: function(dateText, inst){ var type = $(this).attr('id') == 'date-start' ? 'min' : 'max'; weatherData[type] = new Date(dateText); drawMyChart(); } }); $('.period input').on('input',function(event) { if (!$(this).val()) { var type = $(this).attr('id') == 'date-start' ? 'min' : 'max'; weatherData[type] = ''; drawMyChart(); } }); </script> </body> </html> |
アダプターの追加
日付型にするにはアダプターが必要になります
|
1 |
<script src="https://cdn.jsdelivr.net/npm/chartjs-adapter-date-fns/dist/chartjs-adapter-date-fns.bundle.min.js"></script> |
- Time · Chart.js documentation
- GitHub – chartjs/chartjs-adapter-date-fns: date-fns adapter for Chart.js
データの整形(配列)
[{x:日付, y:データ},…] の形になるよう調整
|
1 2 3 4 5 6 |
for (var i = 0; i < str_array.length; i++) { weatherData.data[i] = { x: new Date( weatherData.time[i] ), y: weatherData[mode][i] } } |
グラフの設定
opsions.scales で設定を記述
|
1 2 3 4 5 6 7 8 9 10 |
scales: { x: { type: 'time', time: { unit: 'day', }, min: weatherData.min, max: weatherData.max } } |
time.unit で、ラベルの表示単位を設定。
今回は日毎(時間、月など可能)
日付範囲
日付範囲の設定も調整
|
1 2 3 4 5 6 7 8 |
$('.datepicker').datepicker({ dateFormat: 'yy/mm/dd', onSelect: function(dateText, inst){ var type = $(this).attr('id') == 'date-start' ? 'min' : 'max'; weatherData[type] = new Date(dateText); drawMyChart(); } }); |
動作デモ(CodePen)
See the Pen Untitled by HomeMadeGarbage (@hmg) on CodePen.
テストデータの様子が気持ち悪いですが・・🙇♂️
