さくらのIoT Platform α版 準備編その2
本記事にはアフィリエイト広告が含まれます。
第二弾。こちらの記事の続きです。
目次
今回、まず準備段階としてやりたいのは、下記の三点です。
- GPSのログから地図に経路の表示
- アイコン表示
- 公開用に地図を非表示にする
1. GPSのログから地図に経路の表示
OpenStreetMap & OpenLayers3
地図は家族内のみで確認したいので、非公開サイトでも使える地図を・・・ということで、 OpenStreetMap & OpenLayers3 を使わせていただく事にしました(※GoogleMapAPIやYahooMapAPIは、非公開サイトでの使用は有償版のみでした。)
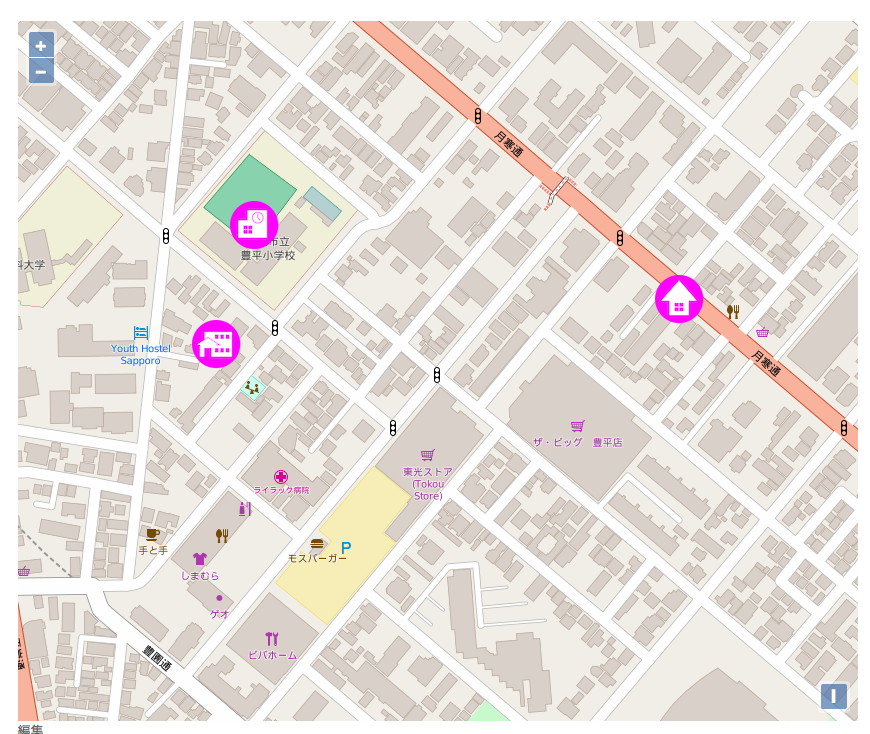
札幌中心部の地図を表示
バッチリです。これがオープンソースとはなんともありがたい限りです。
HMTLのheader
|
1 2 3 4 5 6 7 8 |
<link rel="stylesheet" href="http://openlayers.org/en/v3.16.0/css/ol.css" type="text/css"> <style> .map { height: 700px; width: 100%; } </style> <script src="http://openlayers.org/en/v3.16.0/build/ol.js" type="text/javascript"></script> |
必須なのはjsとcssです。ソースは直接でもDLして自分のサイトに上げても良いようです。ひとまずは直接リンクさせて頂いています。ヘッダは基本的にはこれだけでOKです。
HTMのbody
|
1 2 3 4 5 6 7 8 9 10 11 12 13 14 |
<script type="text/javascript">// <![CDATA[ var map = new ol.Map({ target: 'map', layers: [ new ol.layer.Tile({ source: new ol.source.OSM() }) ], view: new ol.View({ center: ol.proj.fromLonLat([141.35153532, 43.06645018]), zoom: 16 }), }); // ]]></script> |
ここで色々、レイヤーを重ねたり設定を追加していきます。
ログ経路表示
肝心の経路表示は、こちらのサイト様を参考にさせて頂きました。ありがたや・・・!
|
1 2 3 4 5 6 7 8 9 10 11 12 13 14 15 16 17 18 19 20 21 22 23 24 25 26 |
// ログ経路 var lineStrArray = new Array(); var coordArray = new Array(); coordArray.push([緯度, 経度]); (略) coordArray.push([緯度, 経度]); for (i=0; i<(coordArray.length-1); i++) { lineStrArray.push([coordArray[i], coordArray[i+1]]); } var lineStrings = new ol.geom.MultiLineString([]); lineStrings.setCoordinates(lineStrArray); var lineVector = new ol.layer.Vector({ source: new ol.source.Vector({ features: [ new ol.Feature( lineStrings.transform('EPSG:4326', 'EPSG:3857') )] }), style: new ol.style.Style({ stroke: new ol.style.Stroke({ color: '#ff00ff', width: 2 }), }) }); |
2. 家、学校、児童館にアイコン表示
公式の OpenLayers 3 Examples を参考にさせて頂きました。
|
1 2 3 4 5 6 7 8 9 10 11 12 13 14 15 16 17 18 19 20 21 22 23 24 25 26 27 28 29 30 31 32 33 34 35 36 37 38 39 40 41 42 |
// アイコン var iconFeature = new ol.Feature({ geometry: new ol.geom.Point(ol.proj.fromLonLat([経度, 緯度])), }); var iconFeature2 = new ol.Feature({ geometry: new ol.geom.Point(ol.proj.fromLonLat([経度, 緯度])), }); var iconFeature3 = new ol.Feature({ geometry: new ol.geom.Point(ol.proj.fromLonLat([経度, 緯度])), }); var iconStyle = new ol.style.Style({ image: new ol.style.Icon(/** @type {olx.style.IconOptions} */ ({ src: '/wp/wp-content/uploads/map-icon-home.png', })) }); var iconStyle2 = new ol.style.Style({ image: new ol.style.Icon(/** @type {olx.style.IconOptions} */ ({ src: '/wp/wp-content/uploads/map-icon-school.png', })) }); var iconStyle3 = new ol.style.Style({ image: new ol.style.Icon(/** @type {olx.style.IconOptions} */ ({ src: '/wp/wp-content/uploads/map-icon-jidokan.png' })) }); iconFeature.setStyle(iconStyle); iconFeature2.setStyle(iconStyle2); iconFeature3.setStyle(iconStyle3); var vectorSource = new ol.source.Vector({ features: [iconFeature,iconFeature2,iconFeature3] }); var iconLayer = new ol.layer.Vector({ source: vectorSource, }); |
通常の緯度経度で設定するには ol.proj.fromLonLat([経度, 緯度]) で指定する必要がありました。
3. 公開用に地図を非表示にする
地図の透明度を追加。
またまたMatsup’s blog様を参考にさせて頂きました。日本語情報が少ないなか大変ありがたいです。
|
1 2 3 4 5 6 |
var opacity = 0 // 地図 var map1 = new ol.layer.Tile({ opacity: opacity, source: new ol.source.OSM() }); |
その他の設定
マウスホイールでのズームを解除する処理を追加しました。
|
1 2 3 4 5 6 7 8 9 |
var map = new ol.Map({ layers: [map1,lineVector,iconLayer], target: 'map', interactions: ol.interaction.defaults({mouseWheelZoom:false}), view: new ol.View({ center: ol.proj.fromLonLat([経度, 緯度]), zoom: 17 }), }); |
参考にさせていただきました。
OpenLayers 3 Disable Mouse Wheel on Zoom
完成した地図とソースコード
地図

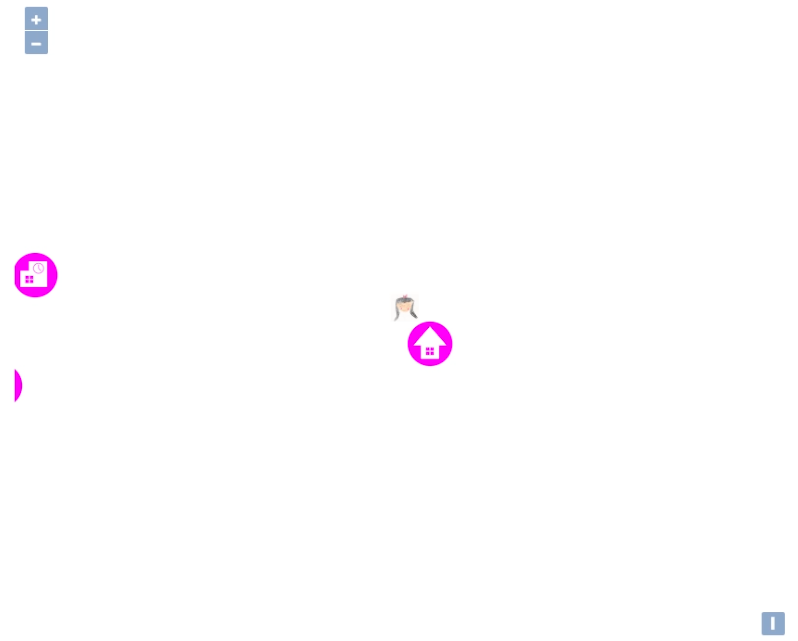
公開用では、地図の透明度を0にしてアイコンと経路だけが表示されるようにします。画像の取得は、地図上で通常の画像同様に「名前を付けて画像を保存…」が出来ました。
ピンクの線はお父ちゃんが歩きまわったログの経路です。起動直後はちょっと不安定?とかで若干正確じゃないデータが入っているそうですが。
ソースコード
|
1 2 3 4 5 6 7 8 9 10 11 12 13 14 15 16 17 18 19 20 21 22 23 24 25 26 27 28 29 30 31 32 33 34 35 36 37 38 39 40 41 42 43 44 45 46 47 48 49 50 51 52 53 54 55 56 57 58 59 60 61 62 63 64 65 66 67 68 69 70 71 72 73 74 75 76 77 78 79 80 81 82 83 84 85 86 87 88 89 90 91 92 93 |
<div id="map" class="map"> </div> <script type="text/javascript">// <![CDATA[ var opacity = 0; // 地図 var map1 = new ol.layer.Tile({ opacity: opacity, source: new ol.source.OSM() }); // アイコン var iconFeature = new ol.Feature({ geometry: new ol.geom.Point(ol.proj.fromLonLat([経度, 緯度])), }); var iconFeature2 = new ol.Feature({ geometry: new ol.geom.Point(ol.proj.fromLonLat([経度, 緯度])), }); var iconFeature3 = new ol.Feature({ geometry: new ol.geom.Point(ol.proj.fromLonLat([経度, 緯度])), }); var iconStyle = new ol.style.Style({ image: new ol.style.Icon(/** @type {olx.style.IconOptions} */ ({ src: '/wp/wp-content/uploads/map-icon-home.png', })) }); var iconStyle2 = new ol.style.Style({ image: new ol.style.Icon(/** @type {olx.style.IconOptions} */ ({ src: '/wp/wp-content/uploads/map-icon-school.png', })) }); var iconStyle3 = new ol.style.Style({ image: new ol.style.Icon(/** @type {olx.style.IconOptions} */ ({ src: '/wp/wp-content/uploads/map-icon-jidokan.png' })) }); iconFeature.setStyle(iconStyle); iconFeature2.setStyle(iconStyle2); iconFeature3.setStyle(iconStyle3); var vectorSource = new ol.source.Vector({ features: [iconFeature,iconFeature2,iconFeature3] }); var iconLayer = new ol.layer.Vector({ source: vectorSource, }); // ログ経路 var lineStrArray = new Array(); var coordArray = new Array(); coordArray.push([緯度, 経度]); (略) coordArray.push([緯度, 経度]); for (i=0; i<(coordArray.length-1); i++) { lineStrArray.push([coordArray[i], coordArray[i+1]]); } var lineStrings = new ol.geom.MultiLineString([]); lineStrings.setCoordinates(lineStrArray); var lineVector = new ol.layer.Vector({ source: new ol.source.Vector({ features: [ new ol.Feature( lineStrings.transform('EPSG:4326', 'EPSG:3857') )] }), style: new ol.style.Style({ stroke: new ol.style.Stroke({ color: '#ff00ff', width: 2 }), }) }); // 地図表示 var map = new ol.Map({ layers: [map1,lineVector,iconLayer], target: 'map', interactions: ol.interaction.defaults({mouseWheelZoom:false}), view: new ol.View({ center: ol.proj.fromLonLat([経度, 緯度]), zoom: 17 }), }); // ]]></script> |
やっとできたー!GPSやら地図のことやらわからないことだらけなので何日もかかりました。
さて、これからどうするか・・・!
近々やっとモジュールも届くそうなので楽しみです。
 お母ちゃん
2016.5.31
