ソーラー発電&Arduino測定の気象データをChart.jsでグラフ化③日付範囲指定
Home > Advent Calendar >
本記事にはアフィリエイト広告が含まれます。
HomeMadeGarbage Advent Calendar 2021 |21日目
目次
前回
ソースコード
|
1 2 3 4 5 6 7 8 9 10 11 12 13 14 15 16 17 18 19 20 21 22 23 24 25 26 27 28 29 30 31 32 33 34 35 36 37 38 39 40 41 42 43 44 45 46 47 48 49 50 51 52 53 54 55 56 57 58 59 60 61 62 63 64 65 66 67 68 69 70 71 72 73 74 75 76 77 78 79 80 81 82 83 84 85 86 87 88 89 90 91 92 93 94 95 96 97 98 99 100 101 102 103 104 105 106 107 108 109 110 111 112 113 114 115 116 117 118 119 120 121 122 123 124 125 126 127 128 129 130 131 132 133 134 135 136 137 138 139 140 141 142 143 144 145 146 |
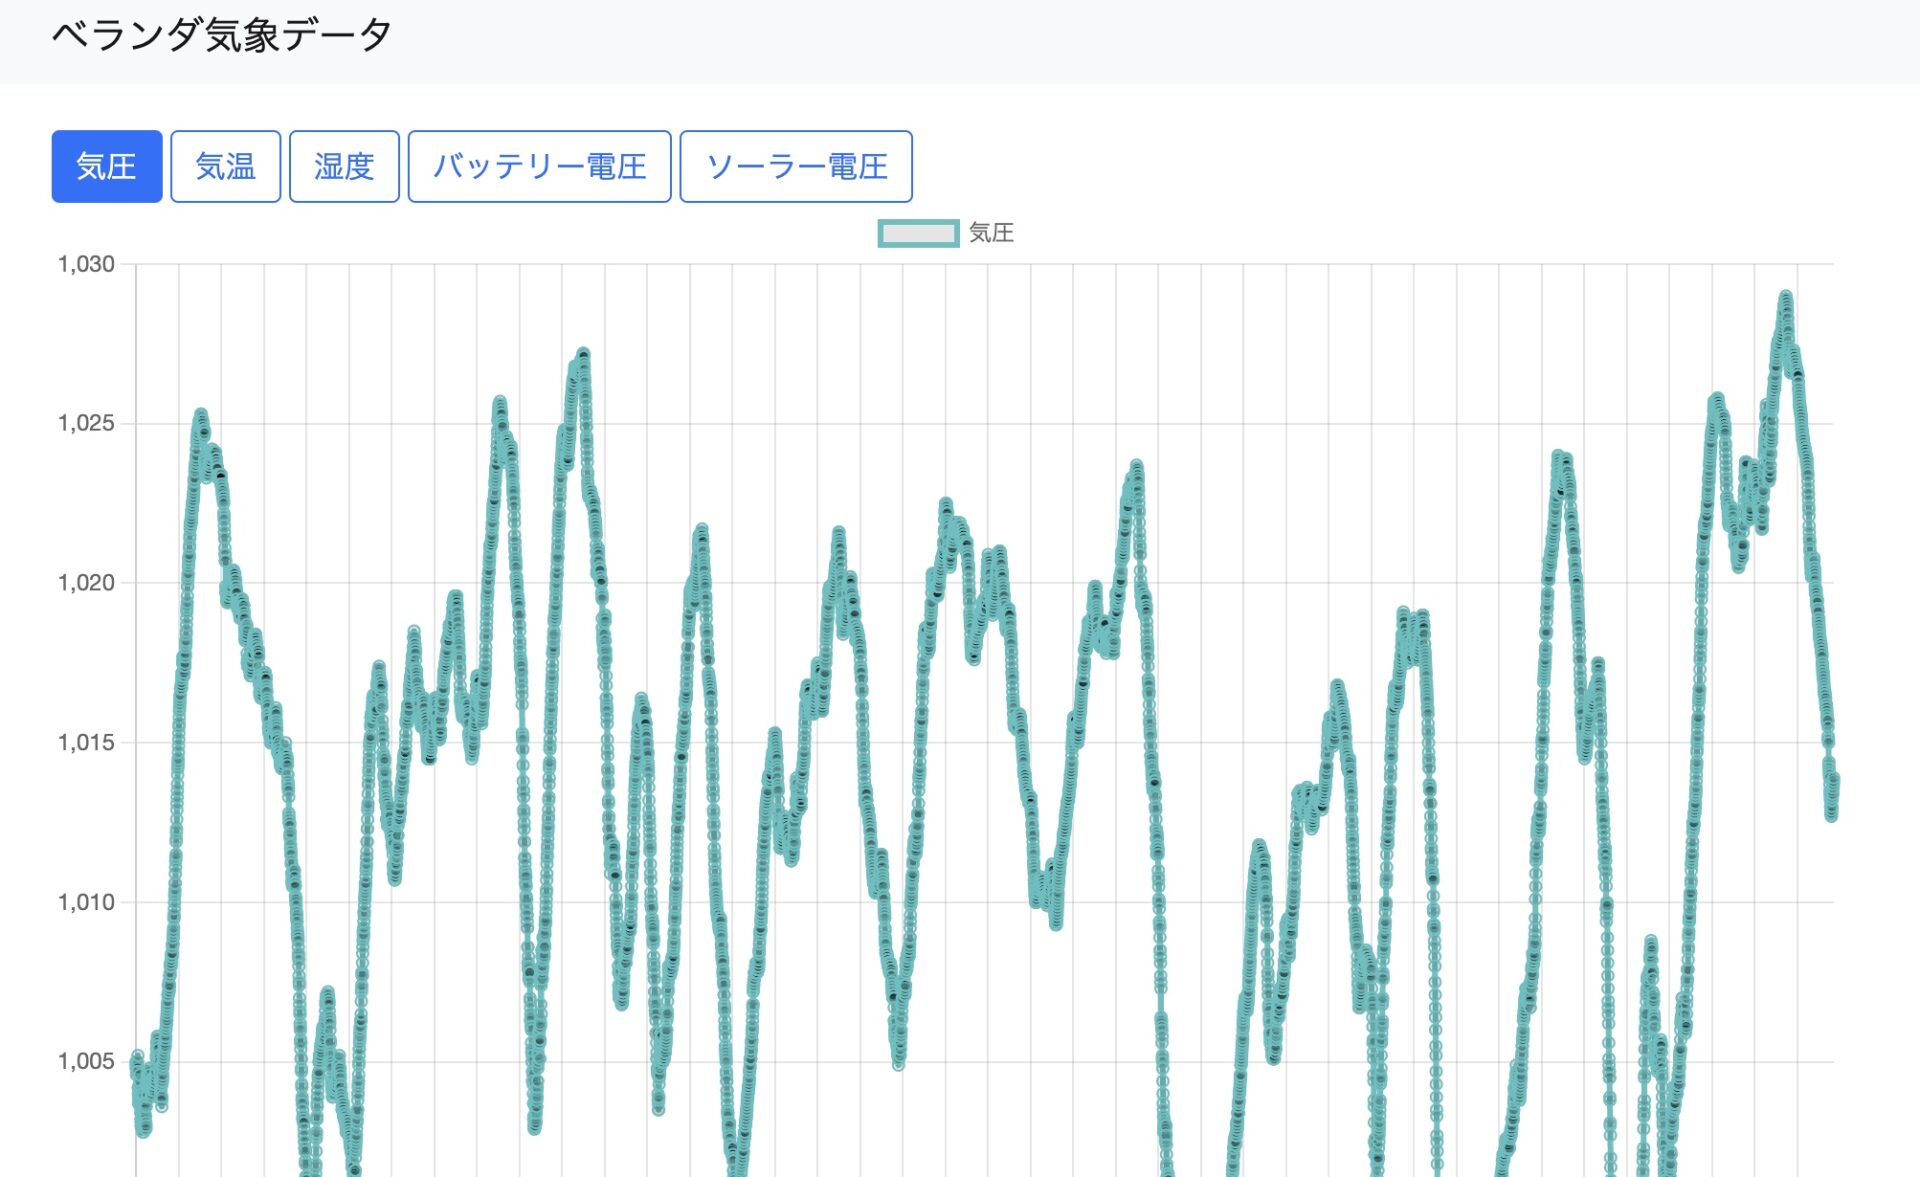
<!doctype html> <html lang="en"> <head> <meta charset="utf-8"> <meta name="viewport" content="width=device-width"> <title>ベランダ気象データ</title> <link href="https://cdn.jsdelivr.net/npm/bootstrap@5.0.0-beta1/dist/css/bootstrap.min.css" rel="stylesheet" integrity="sha384-giJF6kkoqNQ00vy+HMDP7azOuL0xtbfIcaT9wjKHr8RbDVddVHyTfAAsrekwKmP1" crossorigin="anonymous"> <link rel="stylesheet" href="//code.jquery.com/ui/1.13.0/themes/base/jquery-ui.css"> </head> <body> <nav class="navbar navbar-light bg-light mb-4"> <div class="container"> <span class="navbar-brand mb-0 h1">ベランダ気象データ</span> </div> </nav> <div class="container"> <div class="button-type border-bottom pb-2 mb-2"> 種別 <button type="button" class="btn btn-outline-primary active" data-mode="airPressure">気圧</button> <button type="button" class="btn btn-outline-primary" data-mode="temperature">気温</button> <button type="button" class="btn btn-outline-primary" data-mode="humidity">湿度</button> <button type="button" class="btn btn-outline-primary" data-mode="batteryVoltage">バッテリー電圧</button> <button type="button" class="btn btn-outline-primary" data-mode="solarVoltage">ソーラー電圧</button> </div> <div class="period"> 期間 <input type="text" class="form-control d-inline-block datepicker" style="width:150px;" id="date-start"> 〜 <input type="text" class="form-control d-inline-block datepicker" style="width:150px;" id="date-end"> </div> <canvas id="myChart" width="400" height="400"></canvas> </div> <script src="https://code.jquery.com/jquery-3.6.0.min.js" integrity="sha256-/xUj+3OJU5yExlq6GSYGSHk7tPXikynS7ogEvDej/m4=" crossorigin="anonymous"></script> <script src="https://cdnjs.cloudflare.com/ajax/libs/Chart.js/3.6.1/chart.min.js" integrity="sha512-O2fWHvFel3xjQSi9FyzKXWLTvnom+lOYR/AUEThL/fbP4hv1Lo5LCFCGuTXBRyKC4K4DJldg5kxptkgXAzUpvA==" crossorigin="anonymous" referrerpolicy="no-referrer"></script> <script src="https://code.jquery.com/ui/1.13.0/jquery-ui.js"></script> <script> var myChart; var mode = 'airPressure'; // 初期表示:気圧 var weatherData = {}; weatherData.label = { 'batteryVoltage': 'バッテリー電圧', 'solarVoltage': 'ソーラー電圧', 'airPressure': '気圧', 'temperature': '気温', 'humidity': '湿度' }; weatherData.date = []; weatherData.time = []; weatherData.batteryVoltage = []; weatherData.solarVoltage = []; weatherData.airPressure = []; weatherData.temperature = []; weatherData.humidity = []; const str = "<?php echo preg_replace('/\n/',',',file_get_contents('/path/to/file')); ?>"; const str_array = str.split(','); for (var i=0; i<str_array.length; i++) { var _str = str_array[i].replace(/ /,',').replace(/\t/g,',').replace(/ /g,''); var _data = _str.split(','); weatherData.date[i] = _data[0]; weatherData.time[i] = _data[1]; weatherData.batteryVoltage[i] = _data[2]; weatherData.solarVoltage[i] = _data[3]; weatherData.airPressure[i] = _data[4]; weatherData.temperature[i] = _data[5]; weatherData.humidity[i] = _data[6]; } weatherData.min = 0; weatherData.max = str_array.length; function drawMyChart(){ const ctx = document.getElementById('myChart').getContext('2d'); if (myChart) { myChart.destroy(); } myChart = new Chart(ctx, { type: 'line', data: { labels: weatherData.date, datasets: [{ label: weatherData.label[mode], data: weatherData[mode], fill: false, borderColor: 'rgb(75, 192, 192)', tension: 0.1 }] }, options: { responsive: true, scales: { x: { min: weatherData.min, max: weatherData.max } } } }); } drawMyChart(); // グラフ切替 $('.button-type button').click(function(event) { if( !$(this).hasClass('active') ) { $('.button-type button').removeClass('active'); $(this).addClass('active'); mode = $(this).data('mode'); drawMyChart() } }); // datepicker $('.datepicker').datepicker({ dateFormat: 'yy/mm/dd', onSelect: function(dateText, inst){ if ( weatherData.date.indexOf(dateText) === -1 ) { alert('日付が存在しません'); return false; } if ( $(this).attr('id') == 'date-start' ) { weatherData.min = weatherData.date.indexOf(dateText); } else { weatherData.max = weatherData.date.lastIndexOf(dateText); } drawMyChart(); } }); $('.period input').on('input',function(event) { if (!$(this).val()) { if ( $(this).attr('id') == 'date-start' ) { weatherData.min = 0; } else { weatherData.max = str_array.length; } drawMyChart(); } }); </script> </body> </html> |
Chart.js の options 追加
|
1 2 3 4 5 6 7 8 9 |
options: { responsive: true, scales: { x: { min: weatherData.min, max: weatherData.max } } } |
x軸の min と max を設定可能にします。
値は配列番号になります。
初期値は最小&最大値をセット。
|
1 2 |
weatherData.min = 0; weatherData.max = str_array.length; |
日付入力項目
|
1 2 3 4 |
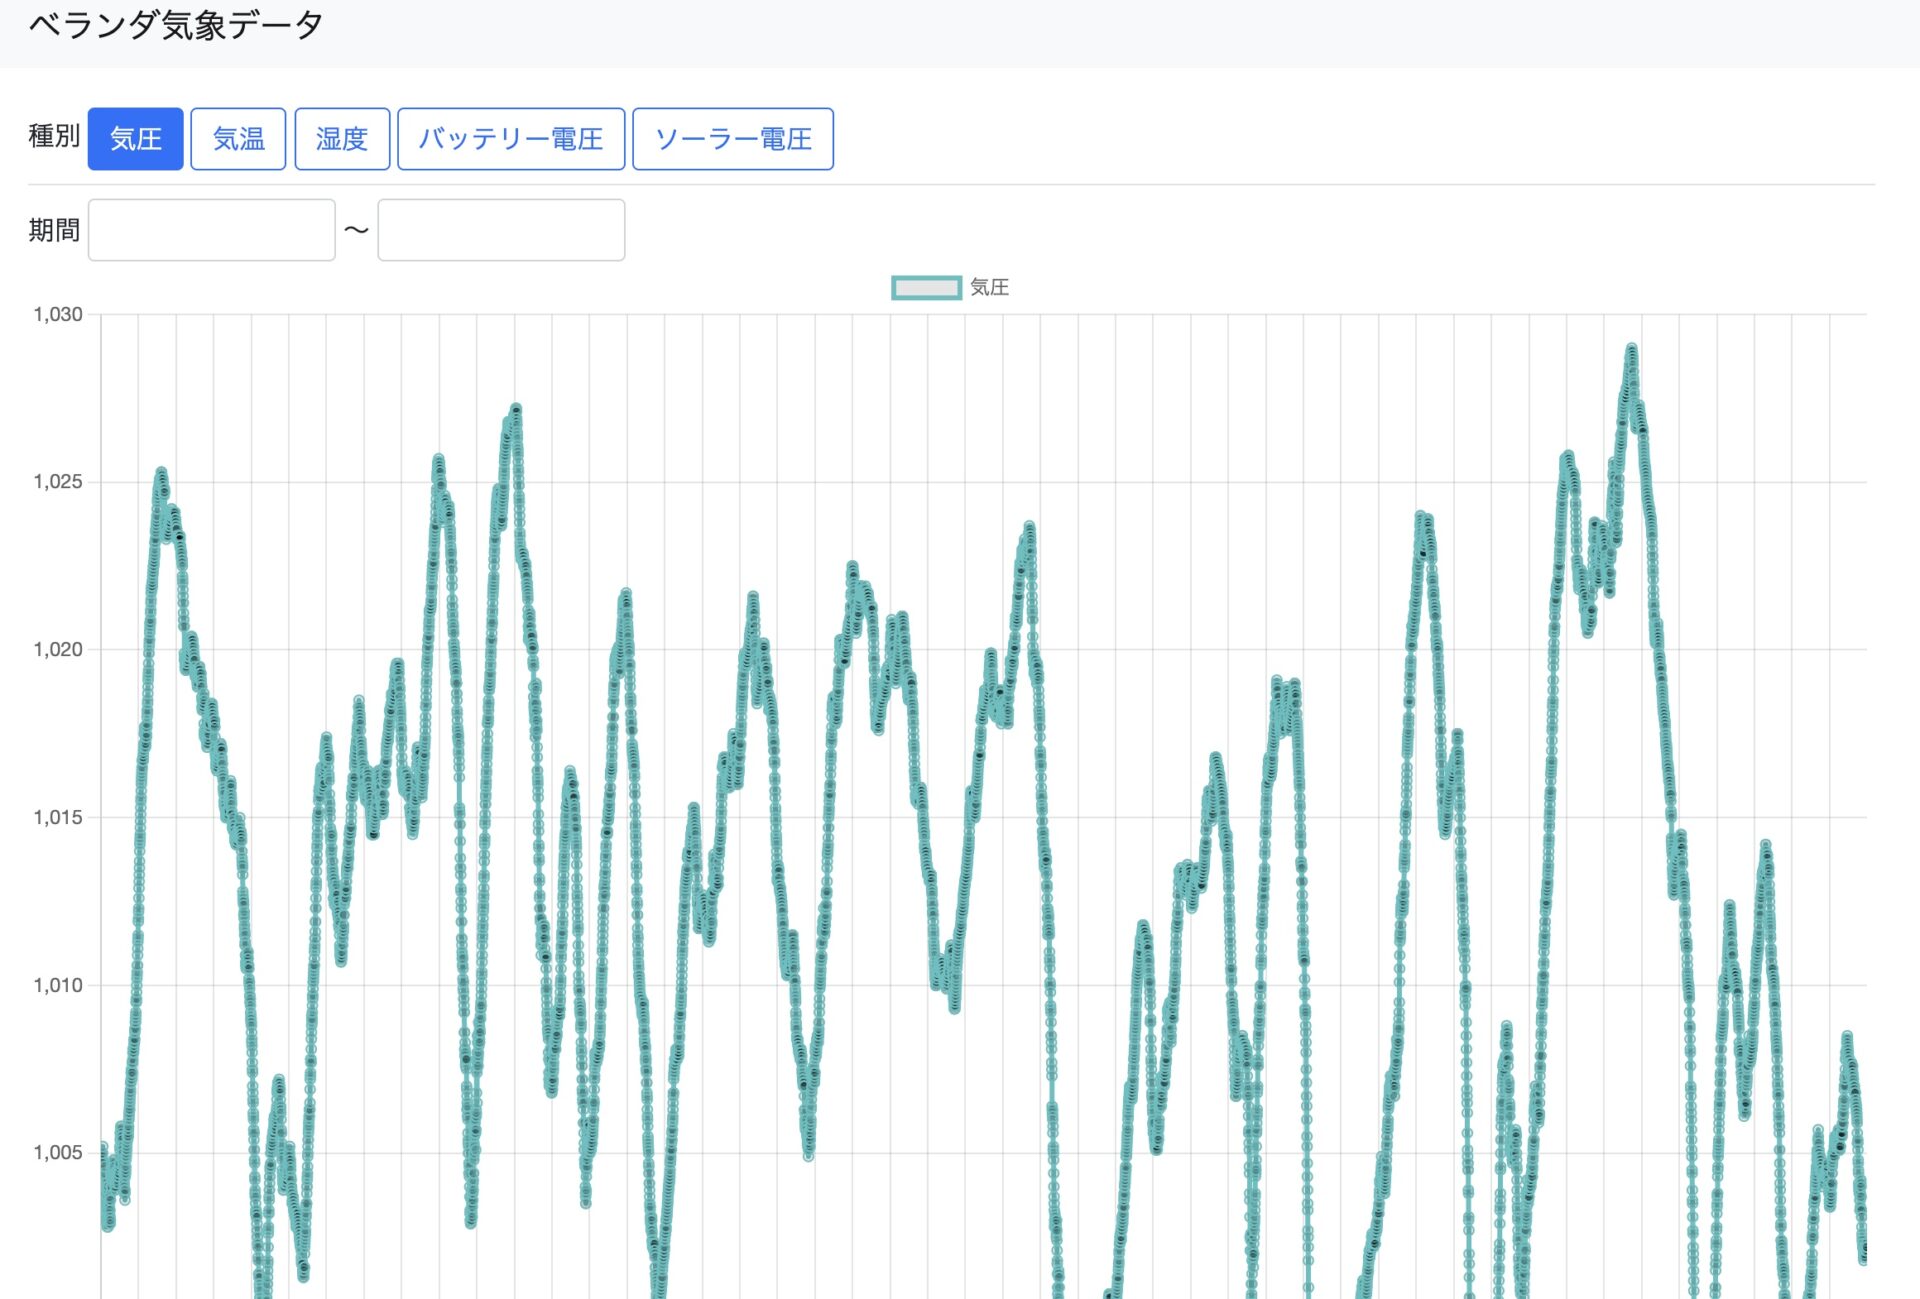
<div class="period"> 期間 <input type="text" class="form-control d-inline-block datepicker" style="width:150px;" id="date-start"> 〜 <input type="text" class="form-control d-inline-block datepicker" style="width:150px;" id="date-end"> </div> |
datepicker の設定
|
1 2 3 4 5 6 7 8 9 10 11 12 13 14 15 16 |
// datepicker $('.datepicker').datepicker({ dateFormat: 'yy/mm/dd', onSelect: function(dateText, inst){ if ( weatherData.date.indexOf(dateText) === -1 ) { alert('日付が存在しません'); return false; } if ( $(this).attr('id') == 'date-start' ) { weatherData.min = weatherData.date.indexOf(dateText); } else { weatherData.max = weatherData.date.lastIndexOf(dateText); } drawMyChart(); } }); |
空欄の場合はリセット
|
1 2 3 4 5 6 7 8 9 10 |
$('.period input').on('input',function(event) { if (!$(this).val()) { if ( $(this).attr('id') == 'date-start' ) { weatherData.min = 0; } else { weatherData.max = str_array.length; } drawMyChart(); } }); |
空欄の場合は範囲指定をリセットします。
動作デモ(CodePen)
See the Pen weather-graph3 by HomeMadeGarbage (@hmg) on CodePen.
